
Random Quote Board
Improving Bit Depth with Decimation?
I'm taking a break from recovering GPS signals in order to take on some issues with an 8-year old Youtube video. Let's start with a bit of background. The new HackRF Pro has a small blurb on its capabilities of:
Extended-precision mode with 16-bit samples for low sample rates (typical ENOB: 9-11)
This led to a discussion on a few forums as to how this is done. When I asked on the Great Scott Gadgets Discord channel as to how this is done, the response was:
to put it simply, if you combine multiple samples by averaging them together, you get fewer samples and increased resolution (Source: User "zyp" on Great Scott Gadgets Discord, 23 Dec 2025)
In response to this discussion, another person on one of my forums provided a link to a Youtube video by "VE6EY" talking about how you can increase bit depth by decimation. VE6EY even linked to one of his own blog posts.
While watching the video and reading his blog post, I realized that VE6EY got some things right, but he made mistakes in both the blog post and in the video. I can boil these down into a few bullet points:
- You can improve SNR and bit depth digitally.
- His method for measuring noise power is incorrect.
- His method for measuring signal-to-noise ratio (SNR) is incorrect.
- Filtering, not the reduction in sample rate, improves the SNR.
Yes, You Can Improve SNR / Bit Depth Digitally
I actually learned this in a tangible way. I was trying to calculate the ENOB using a local FM station received with a RTL-SDR. These SDRs only have 8-bit digitizers, which means a maximum SNR between 40 - 48 dB. But I kept measuring 54 dB. I contacted a friend, someone who has forgotten more about DSP than I will ever know, to ask him about this. His answer was, "You sampled at a high rate and then filtered out most of the quantization noise."
Whoa! Major "light bulb over the head" strike. The math behind what most people use as the dynamic range based on bit depth (6.02*n + 1.76 dB, where "n" is the number of bits per sample) is based on quantization noise. Quantization noise is similar to impulsive noise. Which means that, from a frequency perspective, it is spread evenly over the entire frequency range of the sampled waveform. If you sample higher than Nyquist and filter out the part of the spectrum you do not need, you get rid of quantization noise.
For example, in my original experiment, I was sampling part of the FM band at 2.4 MHz, but filtering to 240 kHz bandwidth, a reduction by a factor of 10. I culled out 90% of the quantization noise, which improved the SNR.
So, yes, you can improve the SNR (and the bit depth, as a result) using digital techniques. The reason this works is filtering, not reducing the sample rate.
The Issues
Let me go through each issue as he brings them up in his video.
Mistake #1: Processing Gain is Due to Decimation and Filtering
No, it's due to the filtering. That's it. To paraphrase John Cleese in "The Pet Shop" sketch (aka "the Dead Parrot" sketch), "The decimation don't enter into it!" It's the filtering. Only the filtering. When you decimate, you filter as part of it in order to ensure you don't wind up with aliasing. It's the filtering part that actually reduces the noise (and hence improves the SNR), not the reduction of the sample rate.
Mistake #2: Measuring SNR in the Frequency Domain
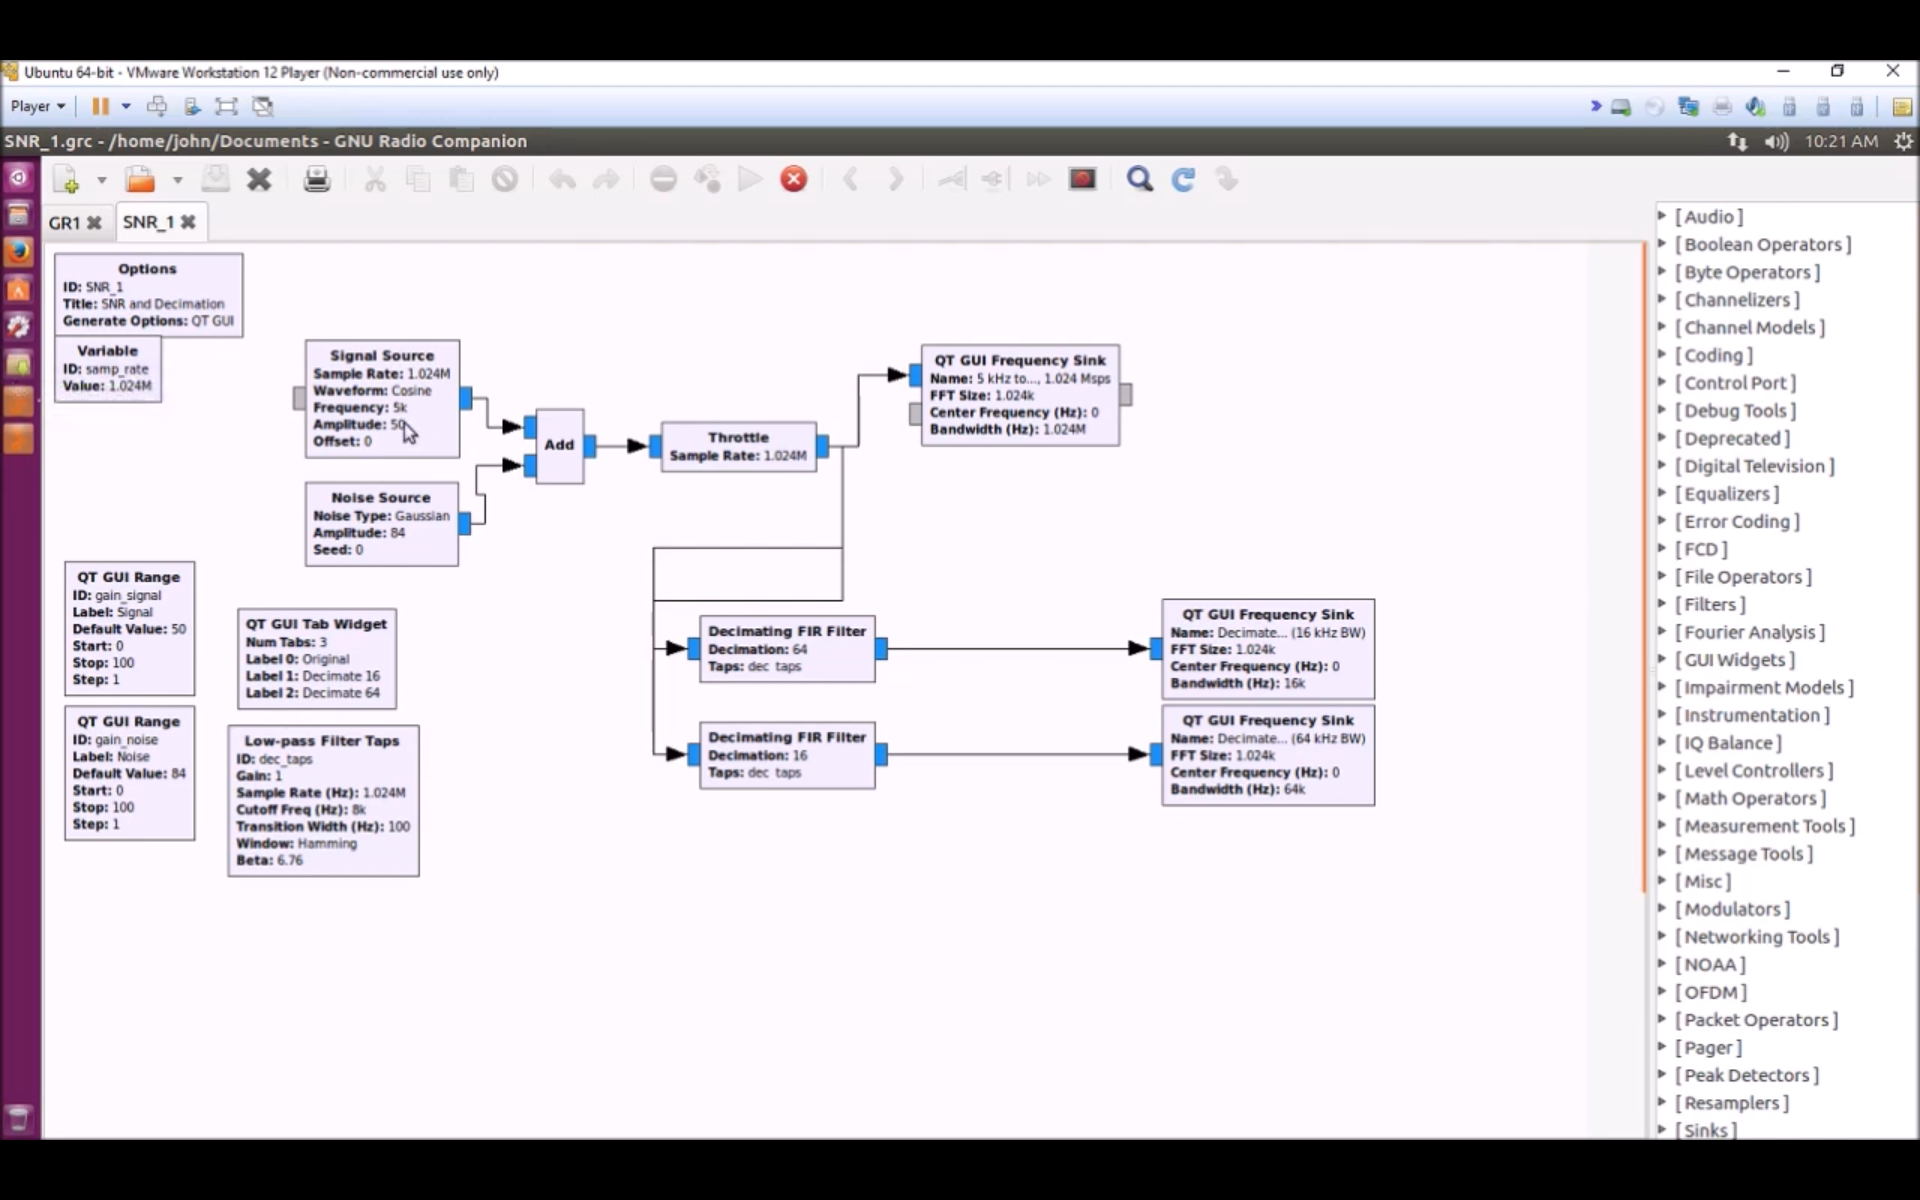
Here is his original flowgraph.
To start, he's using only frequency sinks for his power measurements. Measuring power spectrally has a lot of pitfalls and "gotchas". Things such as the scalloping loss and processing gain of the window. (NOTE: This processing gain is different than what VE6EY is talking about with improving SNR.) Measuring coherent vs noncoherent signals. It's all a pain. As an example of something he should have done, instead of using the Blackman-harris window for his spectral display, he should have used the rectangular window. Regardless, its just MUCH easier to measure power in the time domain. It works the same for both coherent (aka "signals") and noncoherent (aka "noise") energy, and it's straightforward.
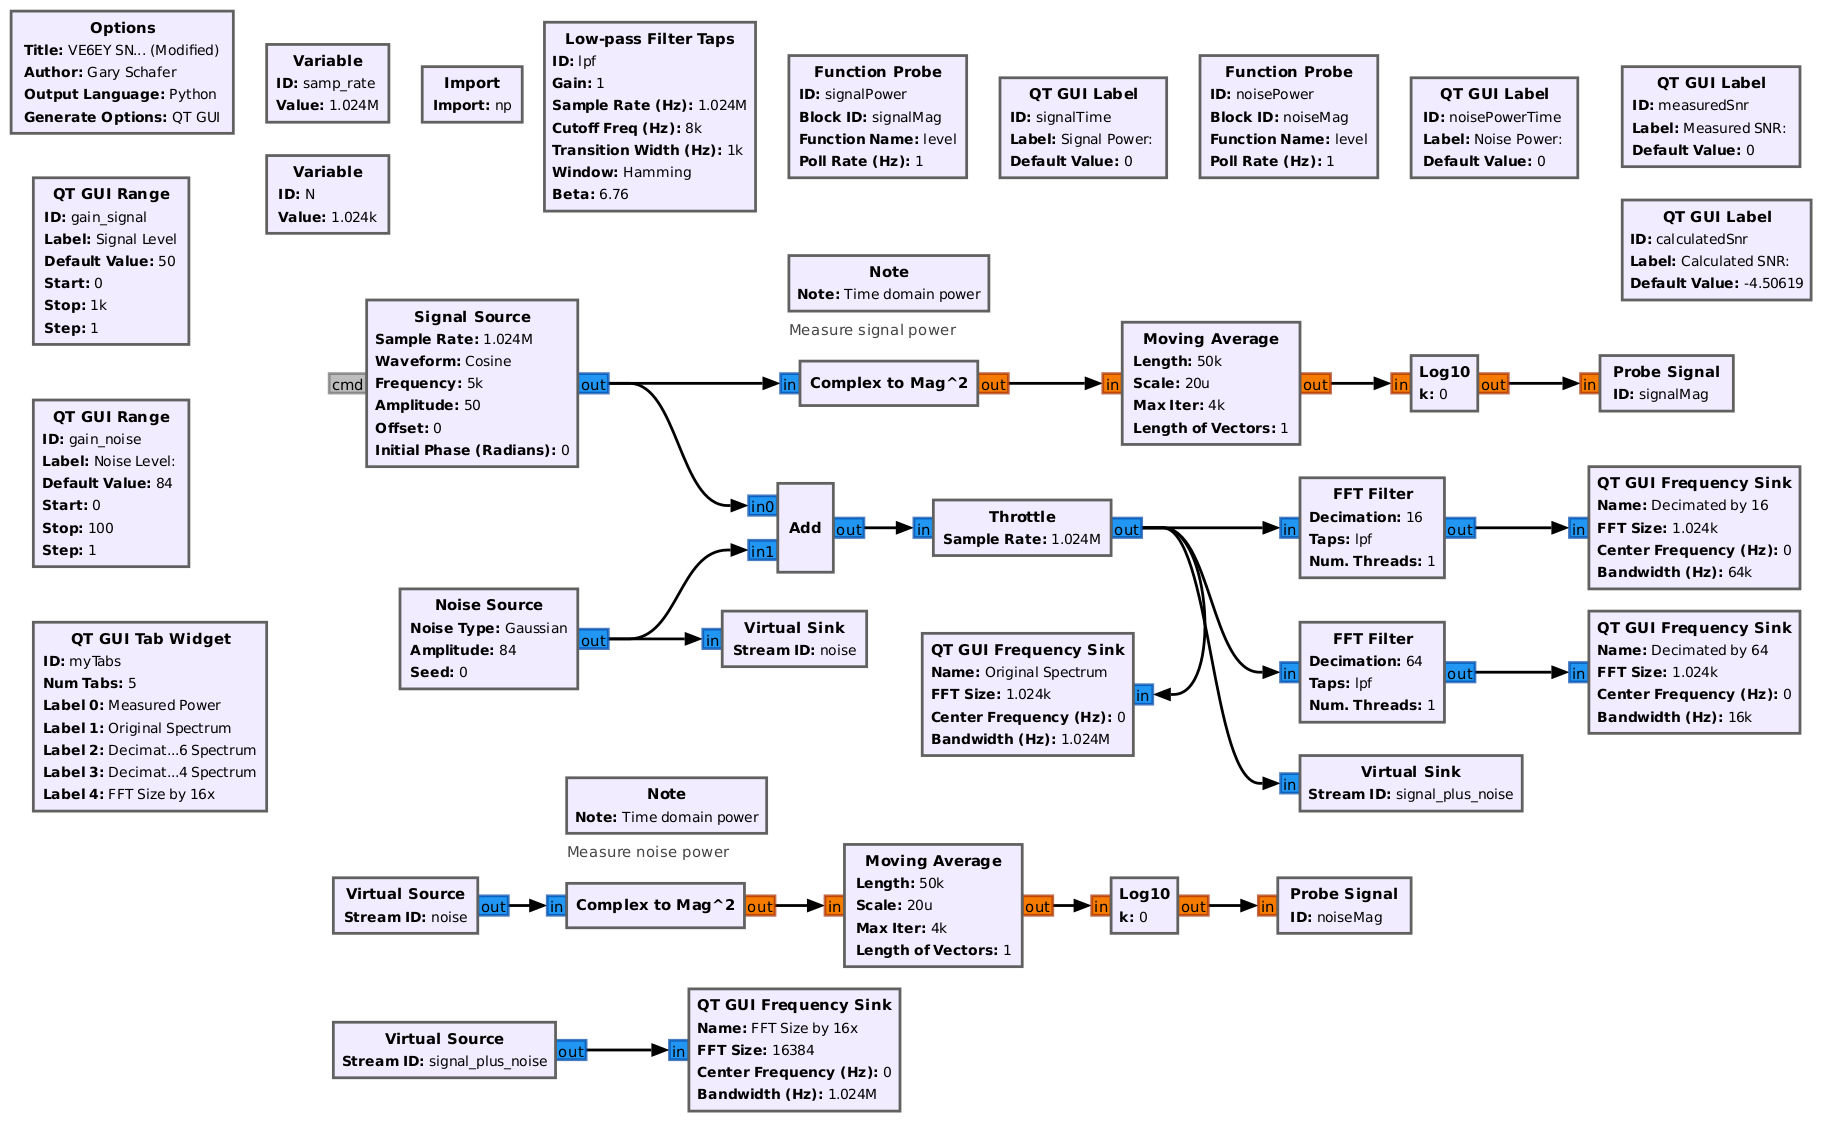
Further, it's much easier to measure SNR (if that's your goal) by measuring the signal and noise individually. Here's a much better way to measure the two power levels individually, then combine them to calculate the SNR:
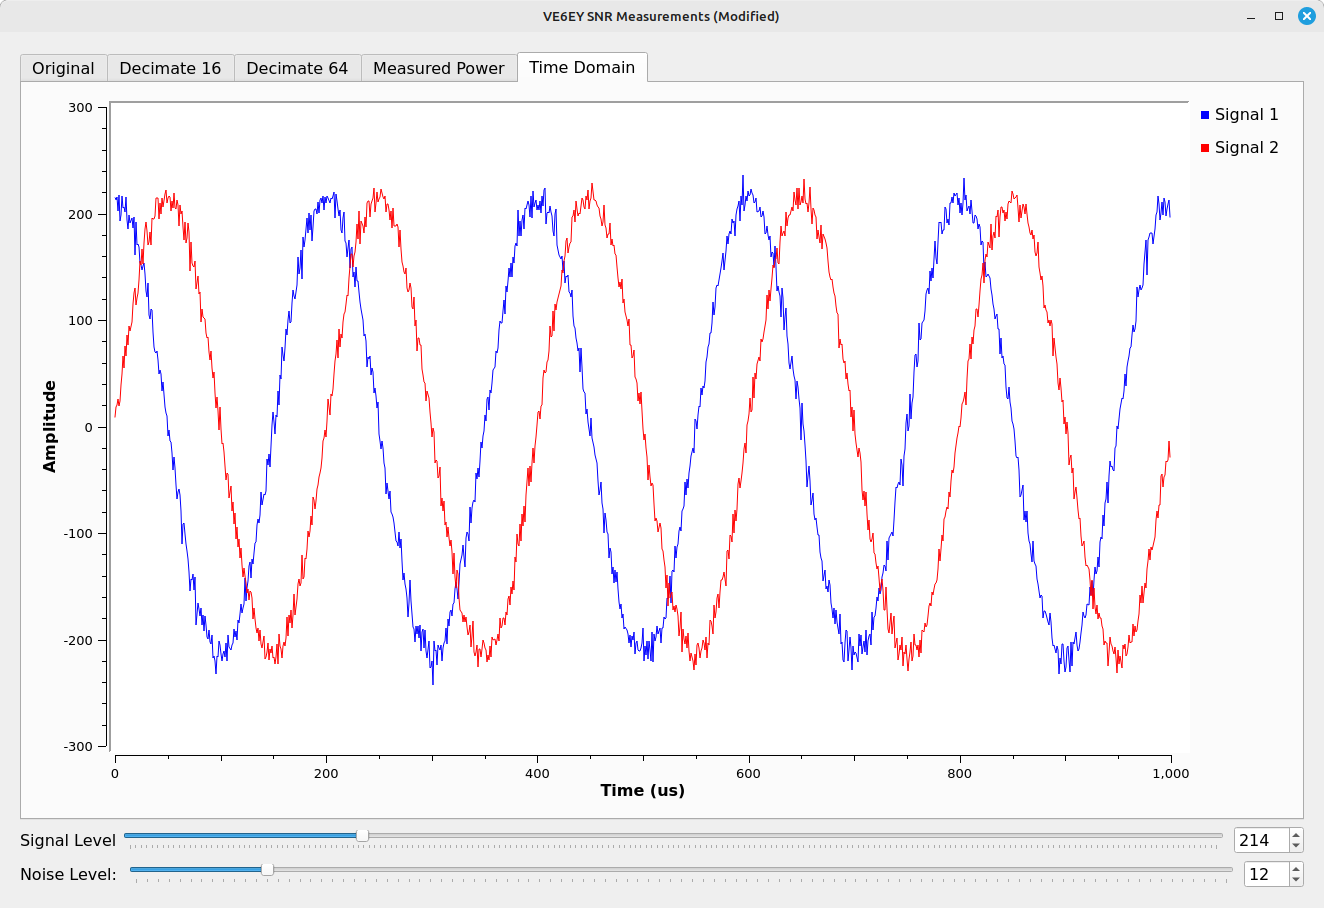
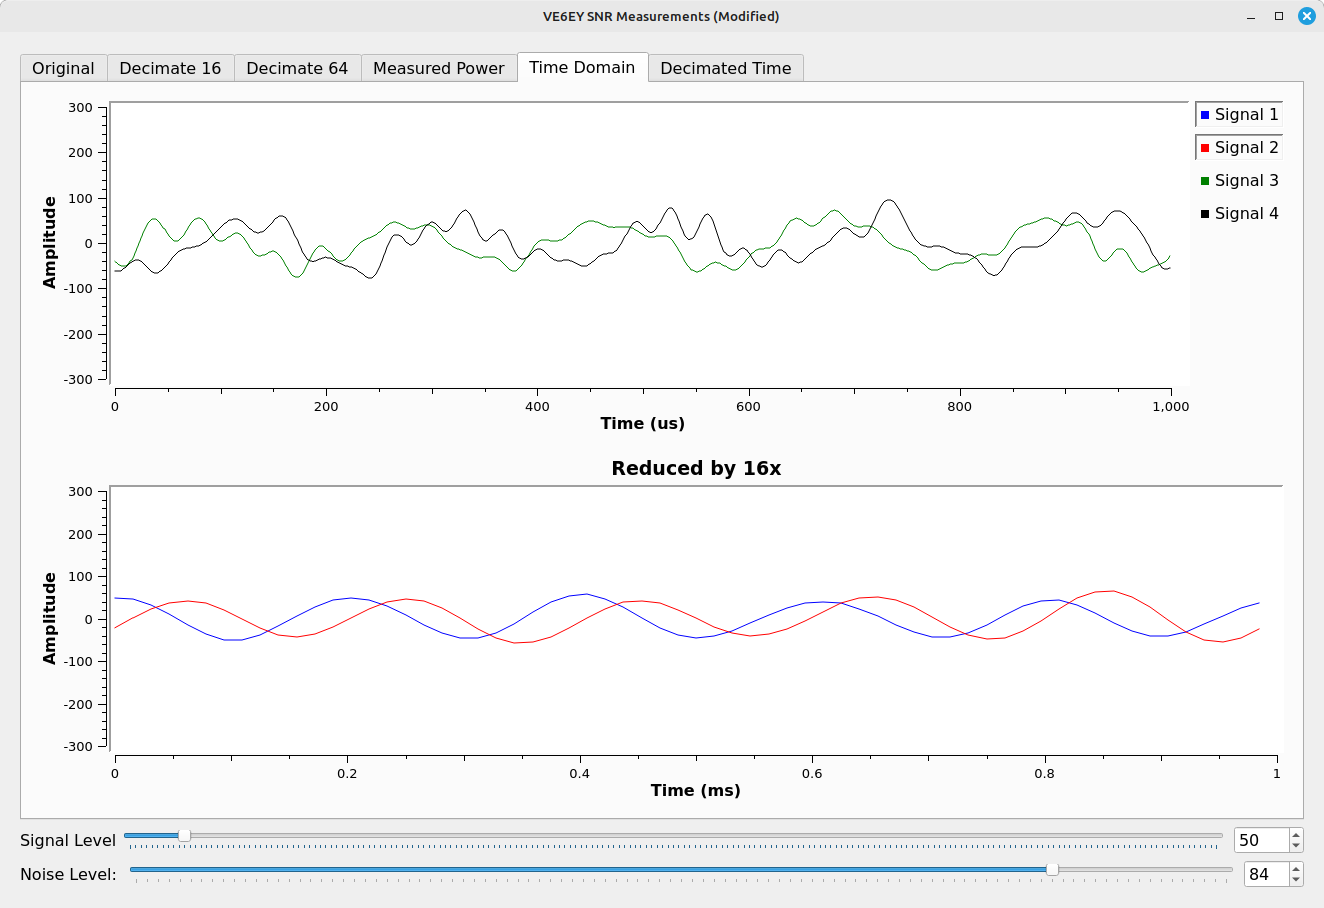
Mistake #3: His Signal is 25 dB Higher than the Noise

When he first starts running his flowgraph, he says that his tone is 25 dB "higher" than the noise. This would at the very least imply that he has a 25 dB SNR.
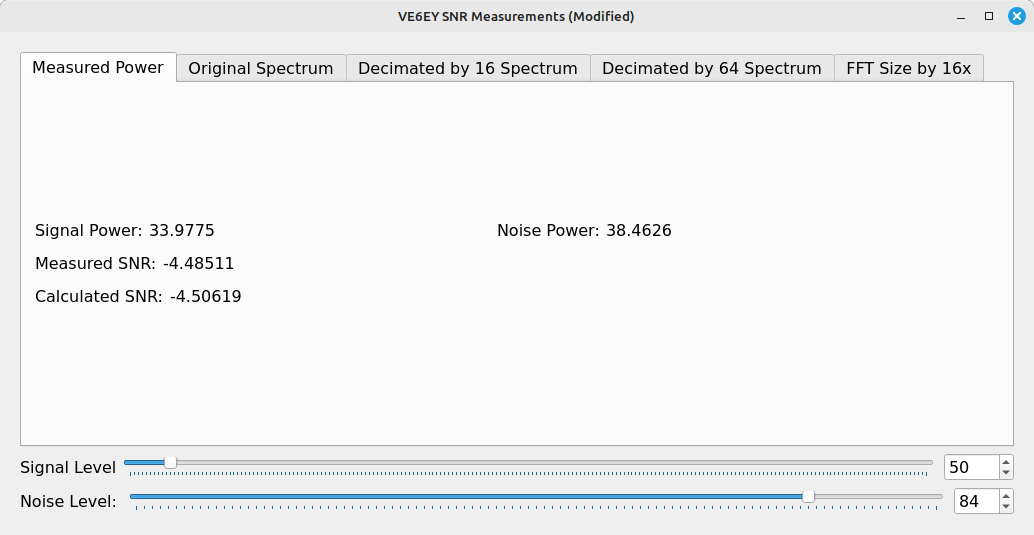
Except, no, it's not. We can actually calculate the SNR based on the two values he's put into the signal source (amplitude = 50) and noise source (amplitude = 84). Since the signal source is complex, the power is this value squared, or signal power = 2500. Likewise, the noise source amplitude sets its standard deviation (equivalent to saying "volts", and also called the RMS value). It's power, too, is the squared value, or noise power = 842 = 7056. This means that the calculated SNR is actually (2500)/(7056) = 0.3543 => -4.5 dB. That's right, what he's actually showing is not a positive 25 dB SNR, but a negative 4.5 dB SNR.
Or we can actually measure the SNR directly using the time domain measurements.
I think its easier to see this low SNR in the time domain. Here's what his tone plus noise looks like in that domain.
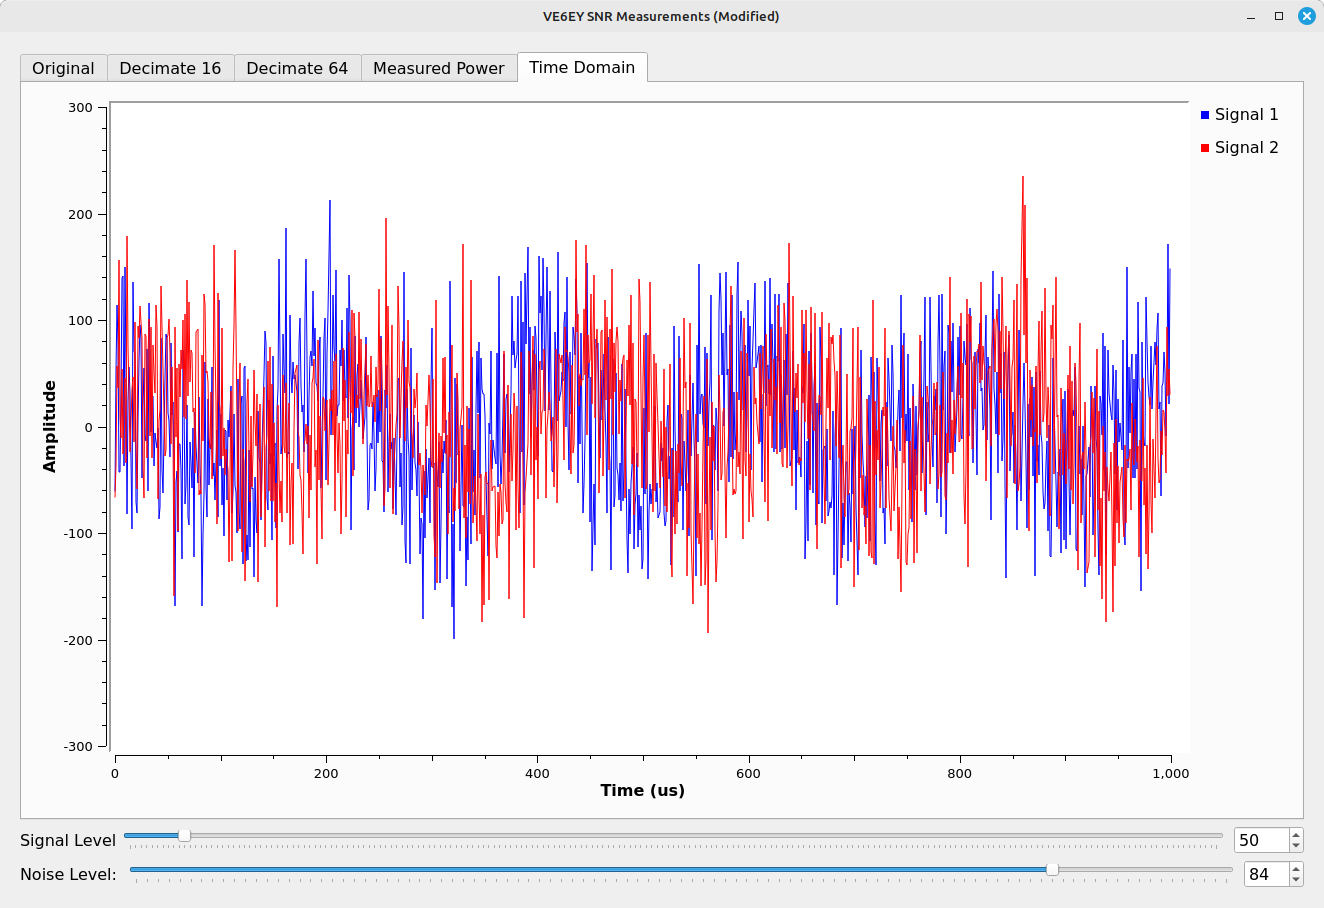
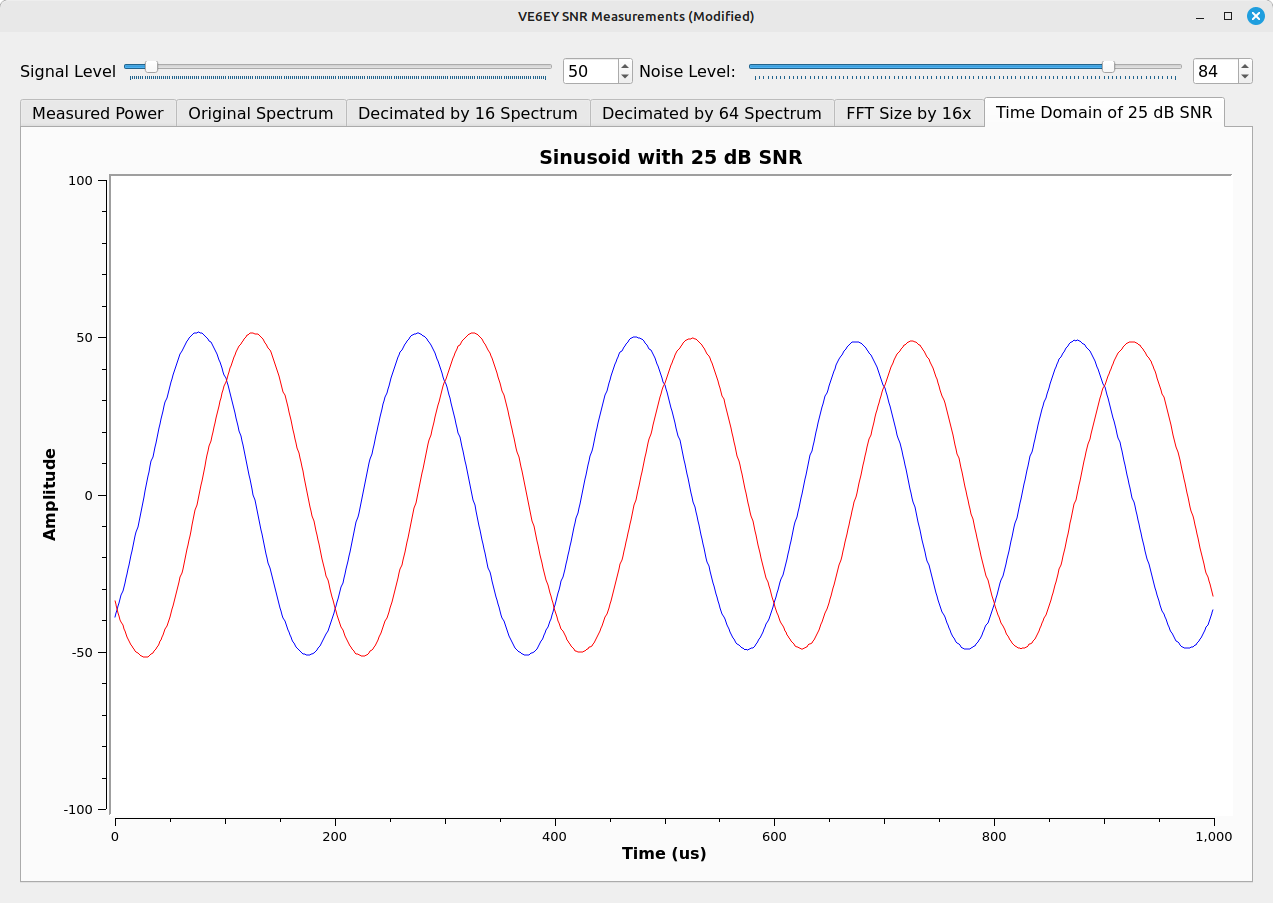
You can still kinda / sorta see that there's a sinusoid buried in there, but it does not look good. In case you're curious, here's what a sinusoid at a 25 dB SNR actually looks like in the time domain:
Mistake #4: You Gain 3 dB for Each Doubling of Decimation
No. You gain 3 dB for every 1/2 reduction of the noise in the available bandwidth. Again, it's not the reduction of sample rate that is important; it's how much noise you've filtered out. He started his tone with a -4.5 dB of SNR, and I've demonstrated how a 25 dB SNR complex sinusoid appears. I can also achieve that same view using his original flowgraph by reducing the total noise by a factor of roughly 1000. In other words, if I drop the noise bandwidth from 1.024 MHz to 1.024 kHz, I'll achieve the desired "sinusoid with 25 dB SNR".
To demonstrate this, I've created a complex bandpass filter with the requisite parameters (bandwidth of 1 kHz) centered on the 5 kHz tone.
Note that I've improved the sinusoid (it looks much cleaner), but I've not touched the sample rate. It's still screaming along at the original rate of 1.024 MHz. Again, it's the filtering.
Mistake #5: He Shows a Lower Noise Floor Which He Says is The Reduced Noise Power
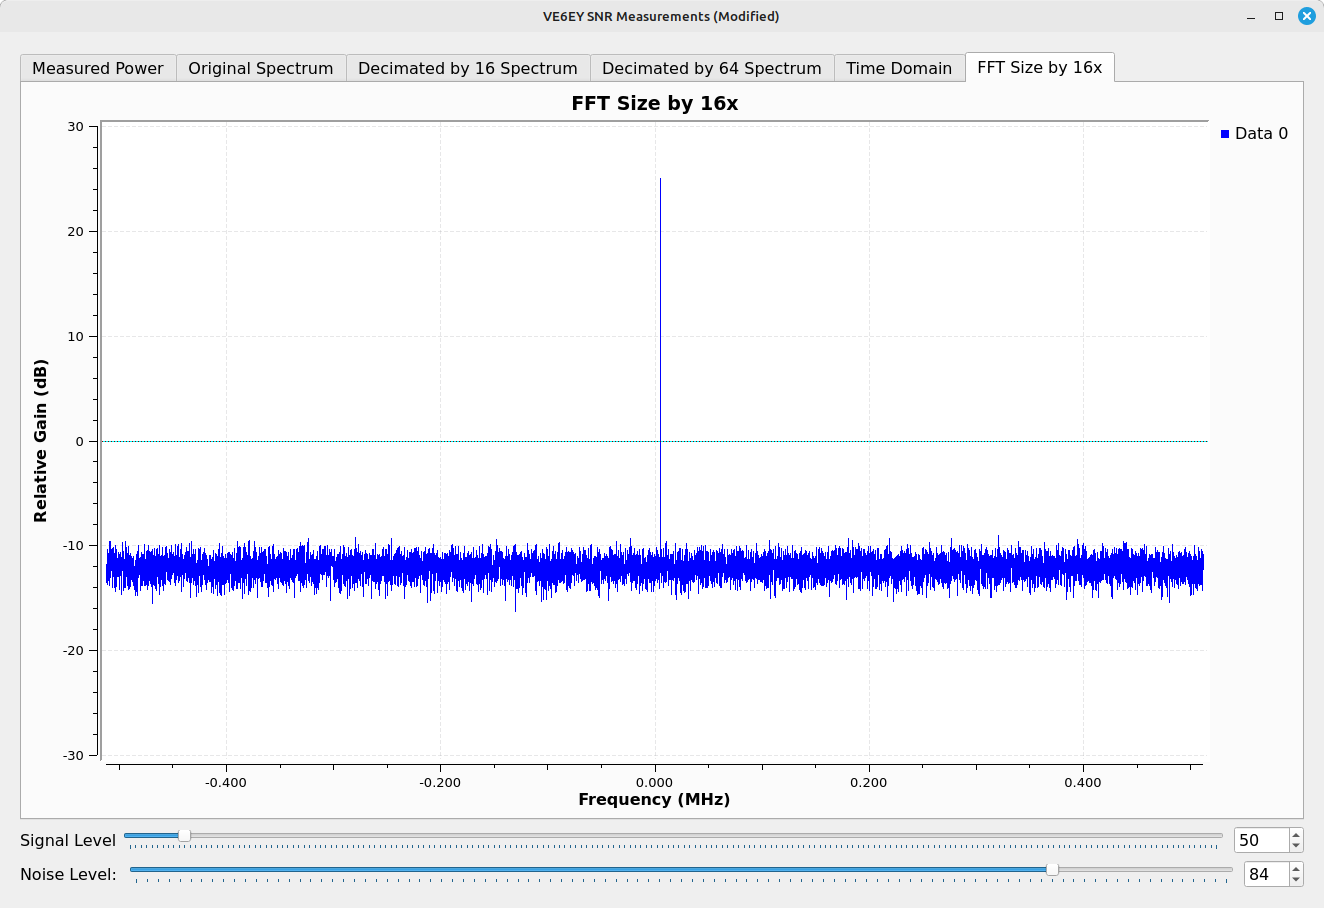
Here's the image he shows to say the noise power has been reduced:
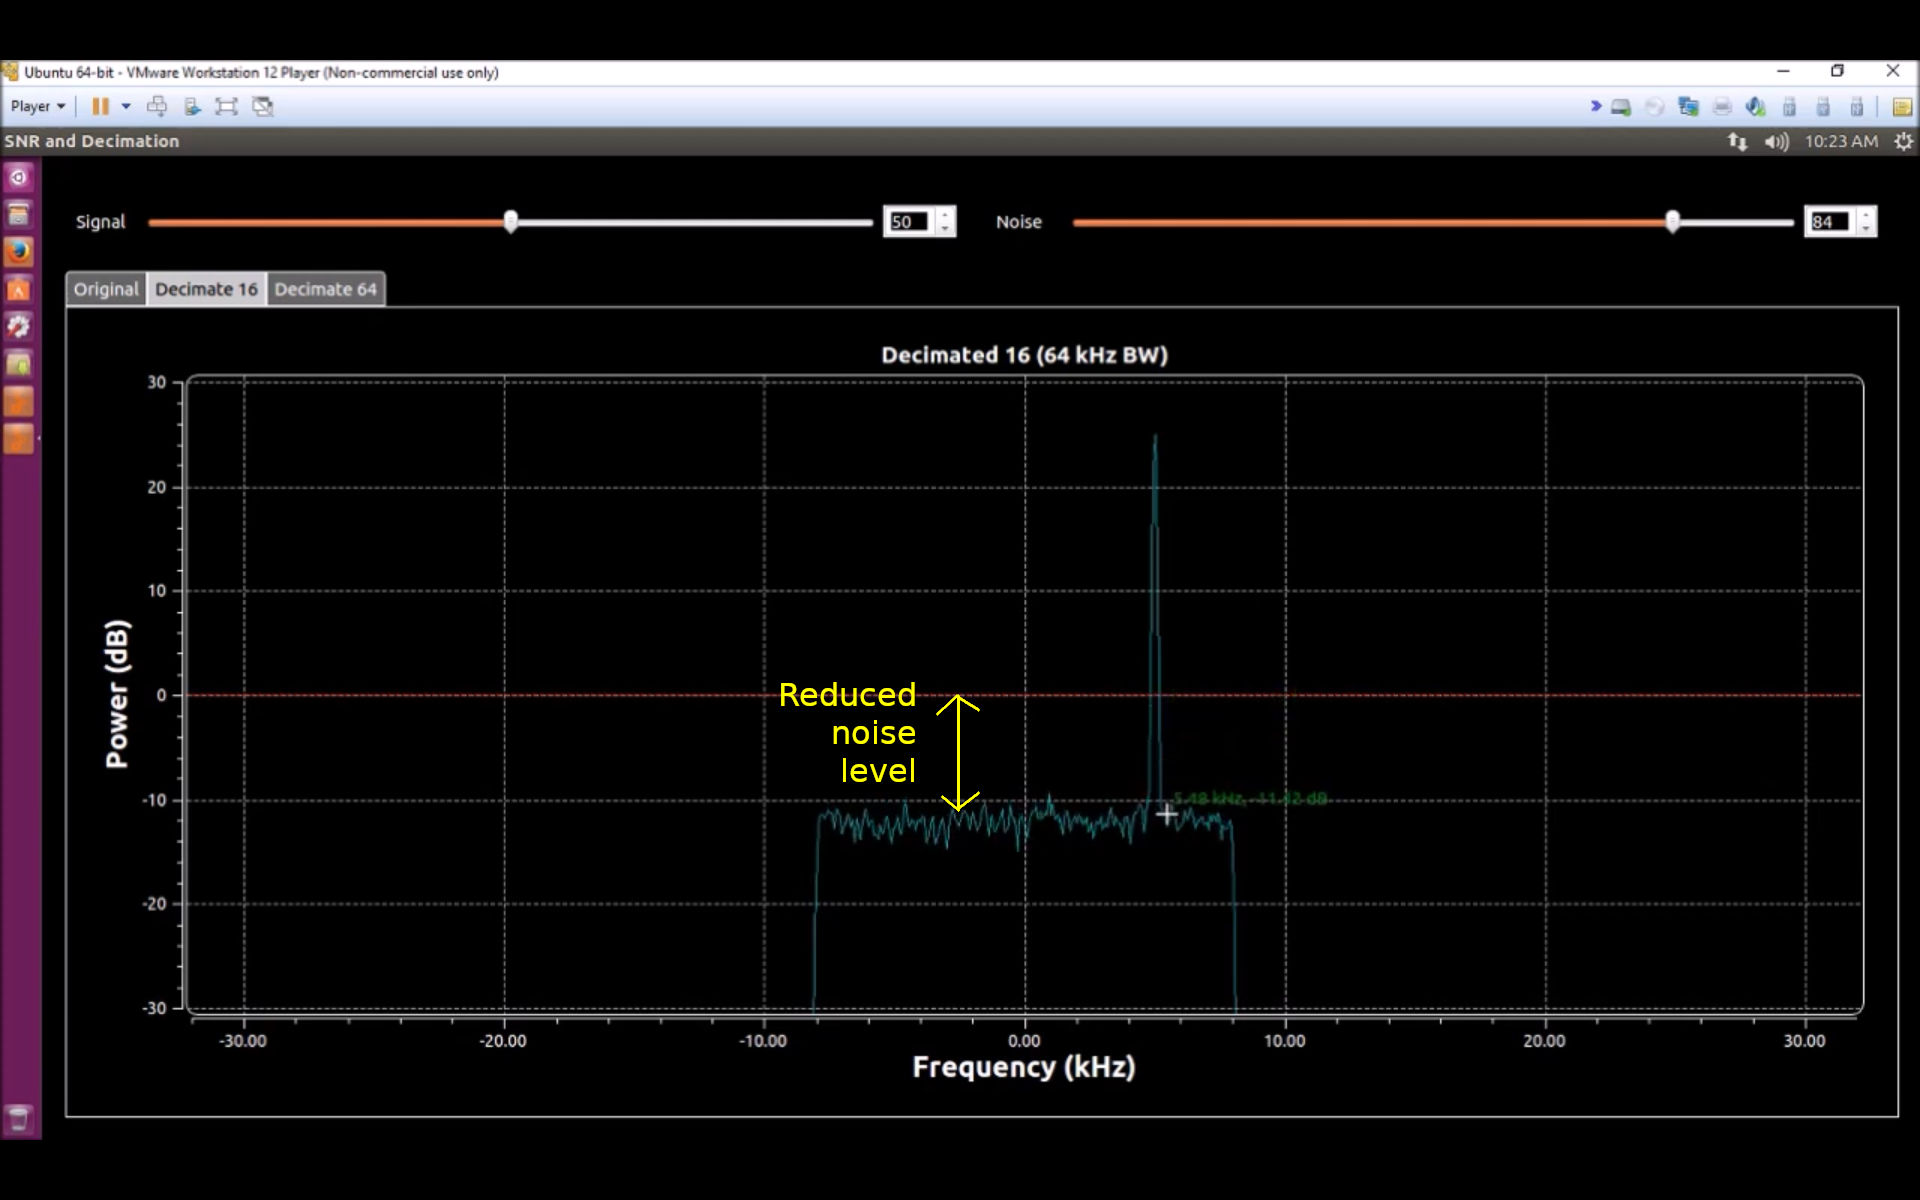
He states, "This shows that the noise level has been reduced." It does, but not in the way that he claims. The "reduced noise" part is actually shown on the sides.
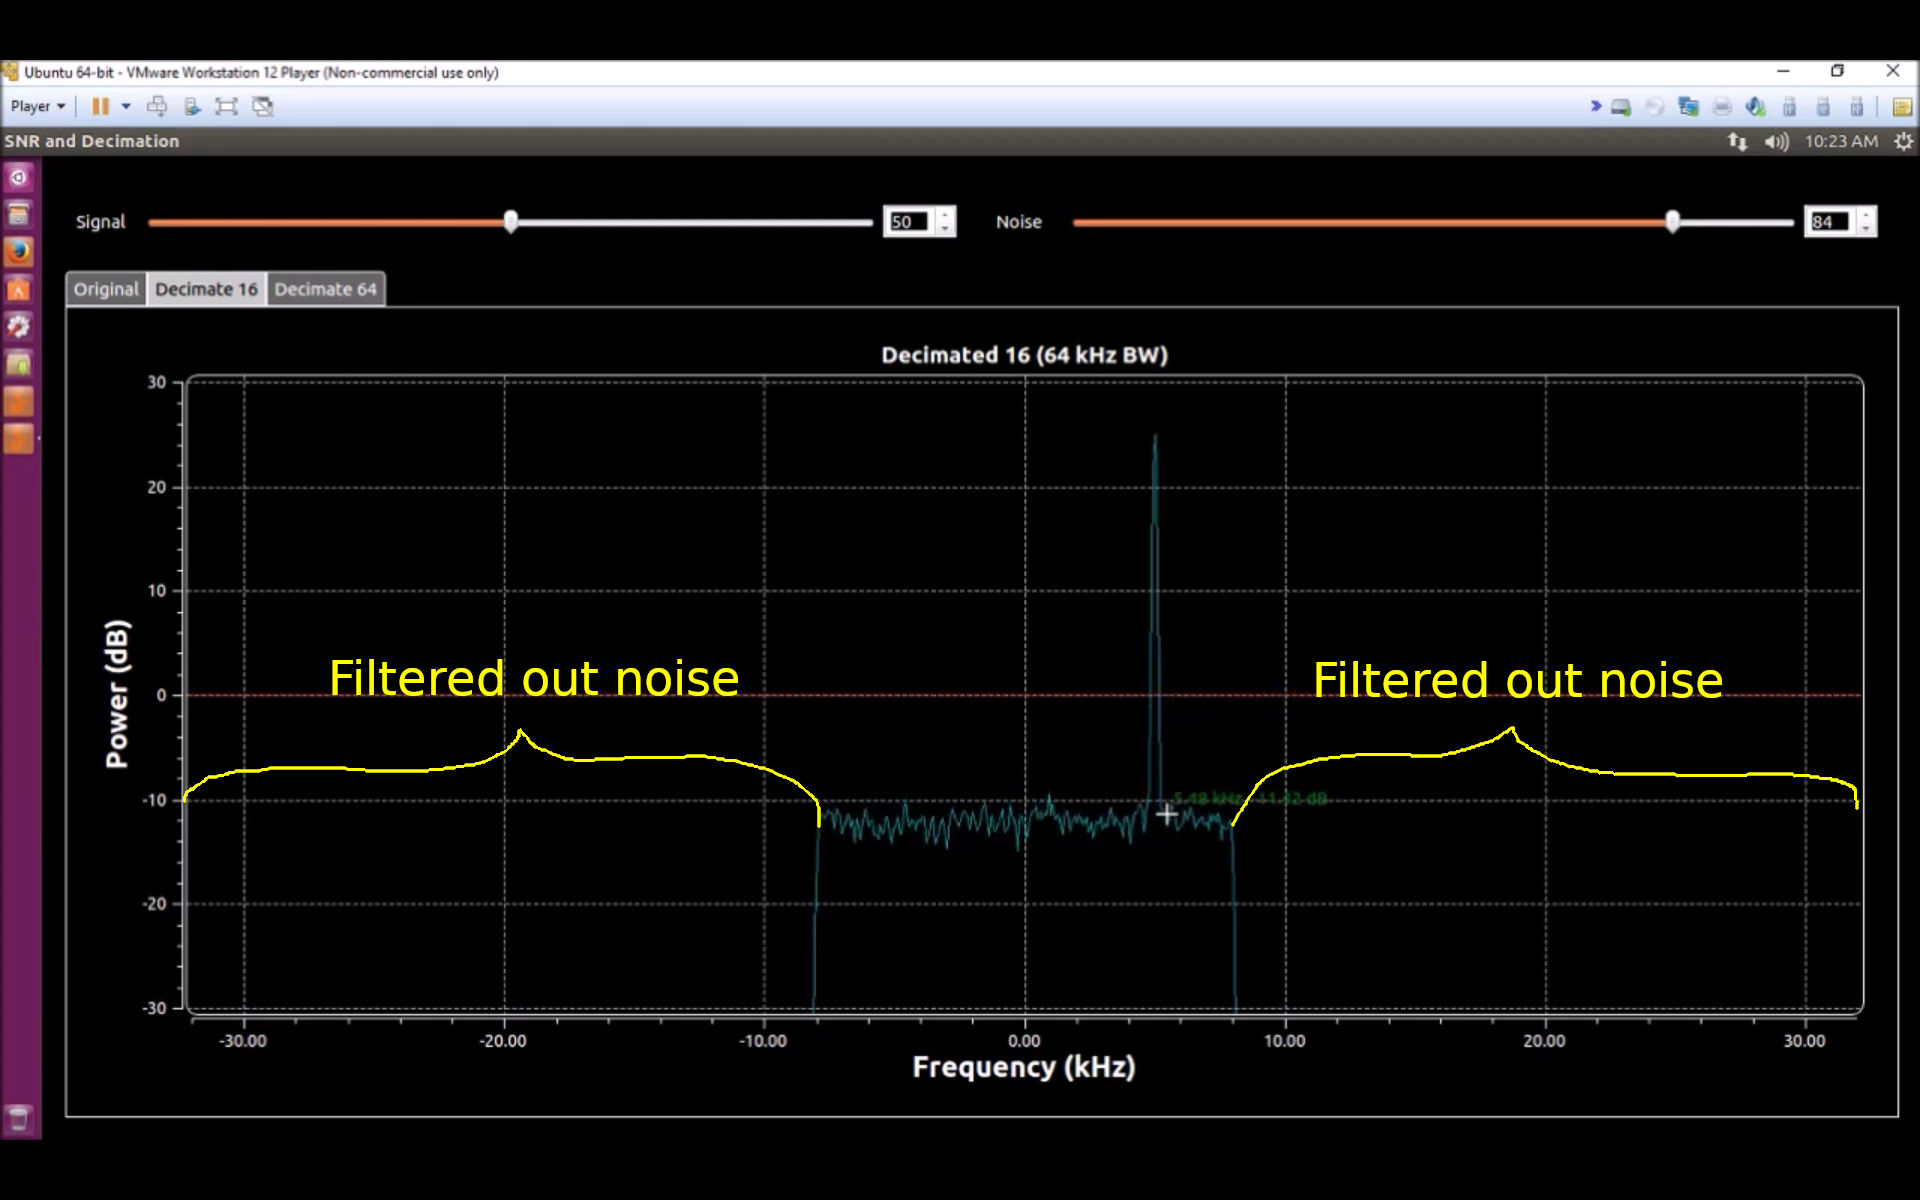
So why is the noise level lowered, as well? That actually is due to the reduction in sample rate. Spectral display noise level is directly related to the resolution bandwidth (RBW). RBW of digital systems is based on sample rate, the number of points in the display, and something called the "window factor". Since he never changes the window factor (which I assume is the default Blackman-harris window for his frequency sink), that only leaves the sample rate and number of points (aka "FFT size") to worry about. He doesn't change the FFT size, but he does lower the sample rate. That, in turn, is why his noise level dropped, not the total noise power. He's dividing the noise into smaller bins; each bin gets a smaller share of noise, so the level drops.
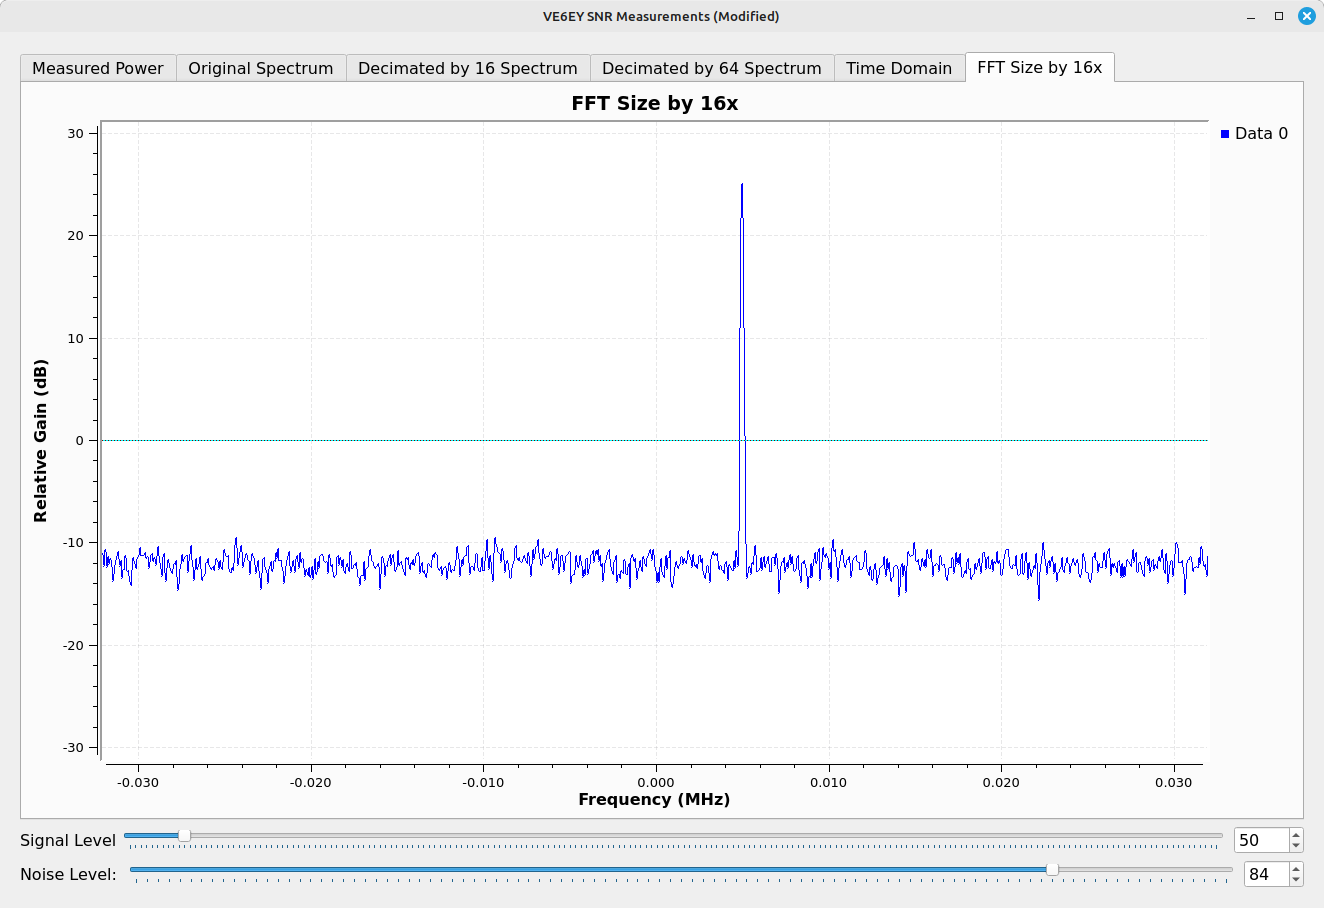
You can lower the noise floor similarly without lowering the sample rate by increasing the number of points. Since he dropped the sample rate by a factor of 16, which also dropped the RBW by a factor of 16, I'll do the same thing but by increasing the FFT size.
Again, the lowered noise floor does not tell you that you've improved the SNR. It's the lack of noise off to the sides that provides any indication of the reduction in noise.
There are two ways you can truly lower your noise.
- Lower your noise power spectral density. This typically involves using a low noise amplifier (LNA) at the front end of your receiver, adding more gain to that same LNA, and/or removing as much attenuation in your front end as you can.
- Remove (i.e. filter) noise outside of your bandwidth.
I'm claiming that he's actually doing the second; VE6EY seems to be claiming both.
The noise power spectral density is the same between his original spectrum and all of the follow-on spectal displays he shows. You can calculate the noise power spectral density (roughly) based on the DANL and the ENBW of the display. The ENBW is the RBW, which can be calculated based on the sample rate, FFT size and window factor. The window factor for the Blackman-harris window (the one most likely being used in the frequency sink) is 2.0044. Multiply this by the binwidth (sample rate divided by the FFT size) and you get the ENBW. That comes out to be 2004.4 kHz. Given his initial display showing a DANL of roughly 0 dB, his noise power spectral density will be 0 dB - 10*log10(2004.4) = -33 dB/Hz.
Jumping to his first "reduced" noise level showing a DANL of -12 dB, his sample rate has now dropped by 16x. Thus, his ENBW is now roughly 125 Hz. This corresponds to a noise power spectral density of -12 dB - 21 dB = -33 dB/Hz. It's the same power spectral density as before. Again, that drop in the noise level between his first display and the other two is a misunderstanding of what's actually happening.
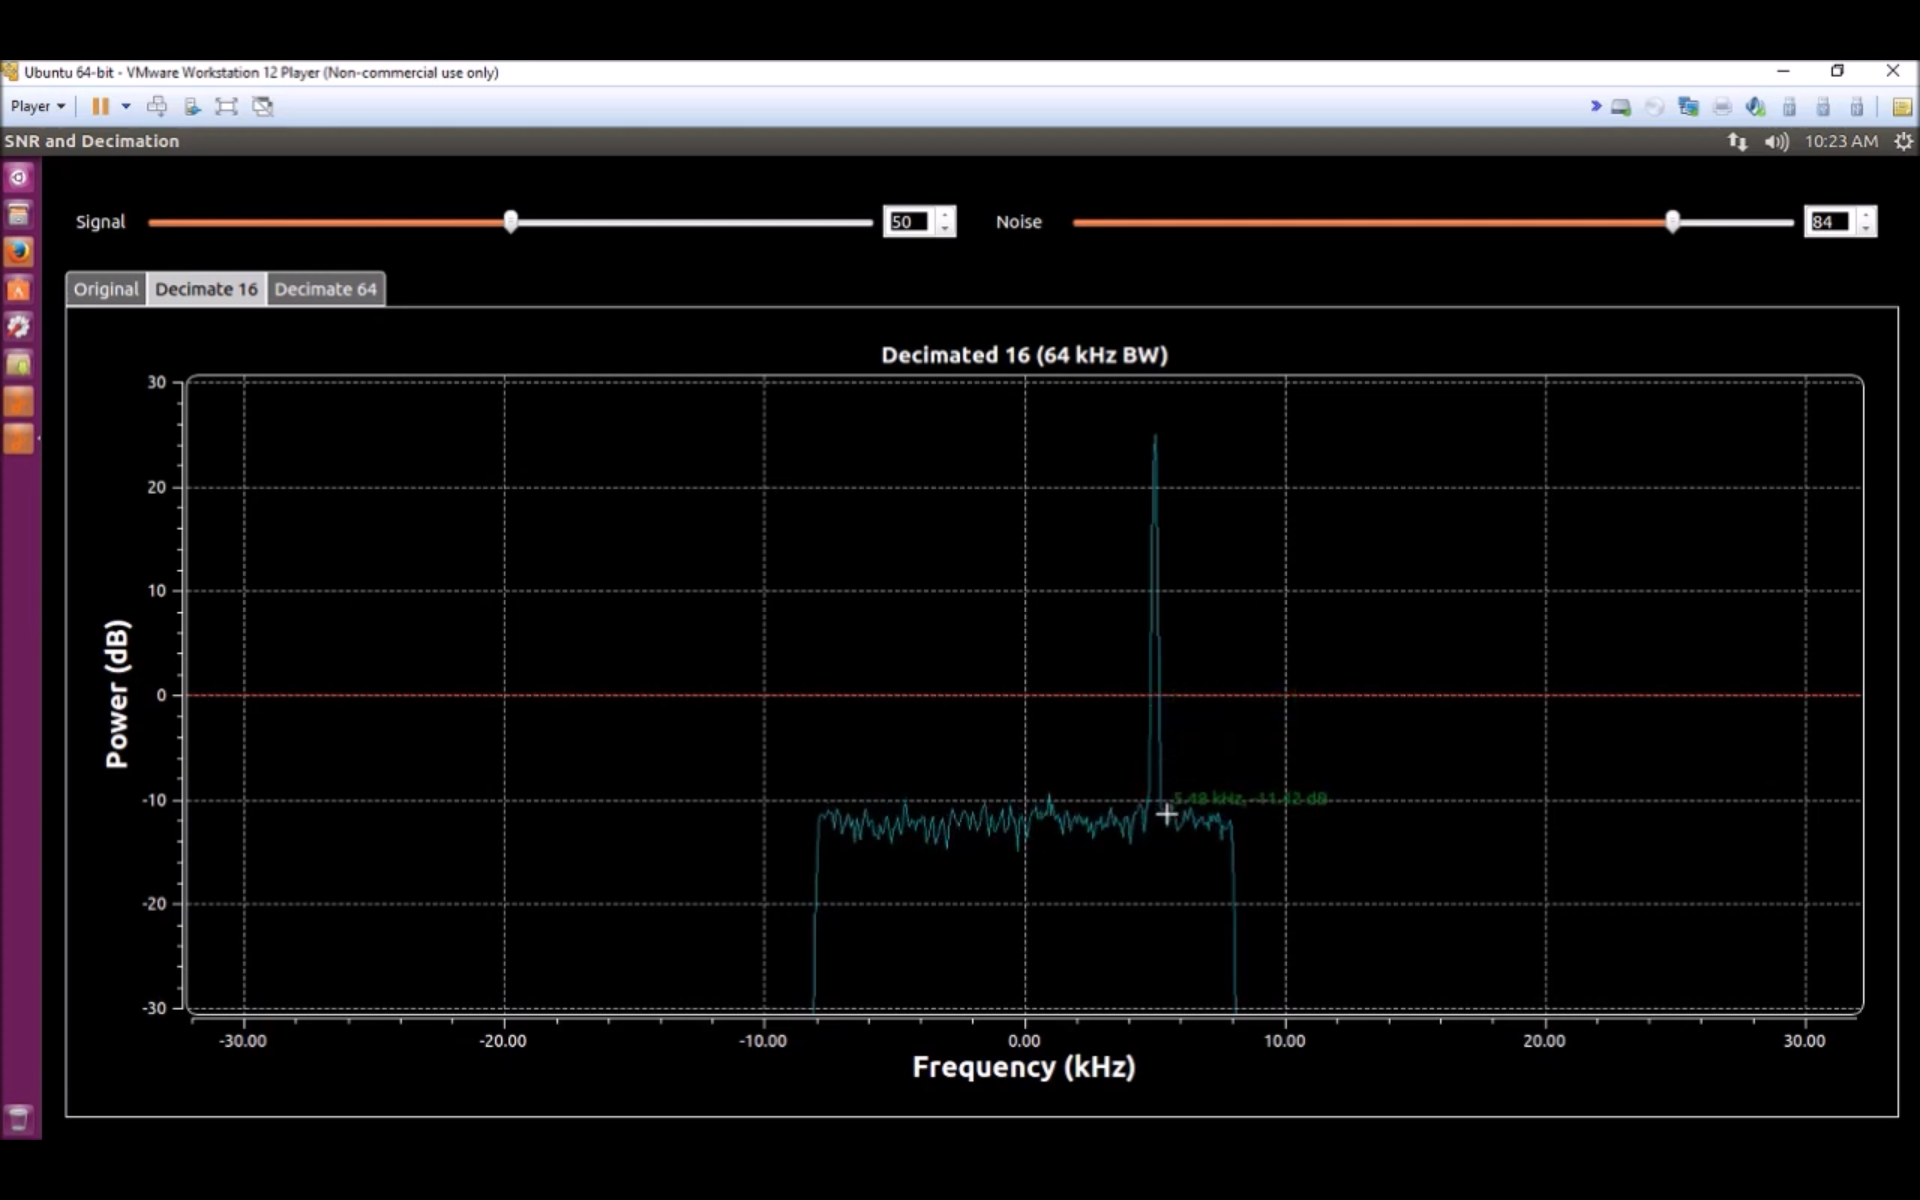
Let's look at the noise level of the decimated-by-64 spectrum.
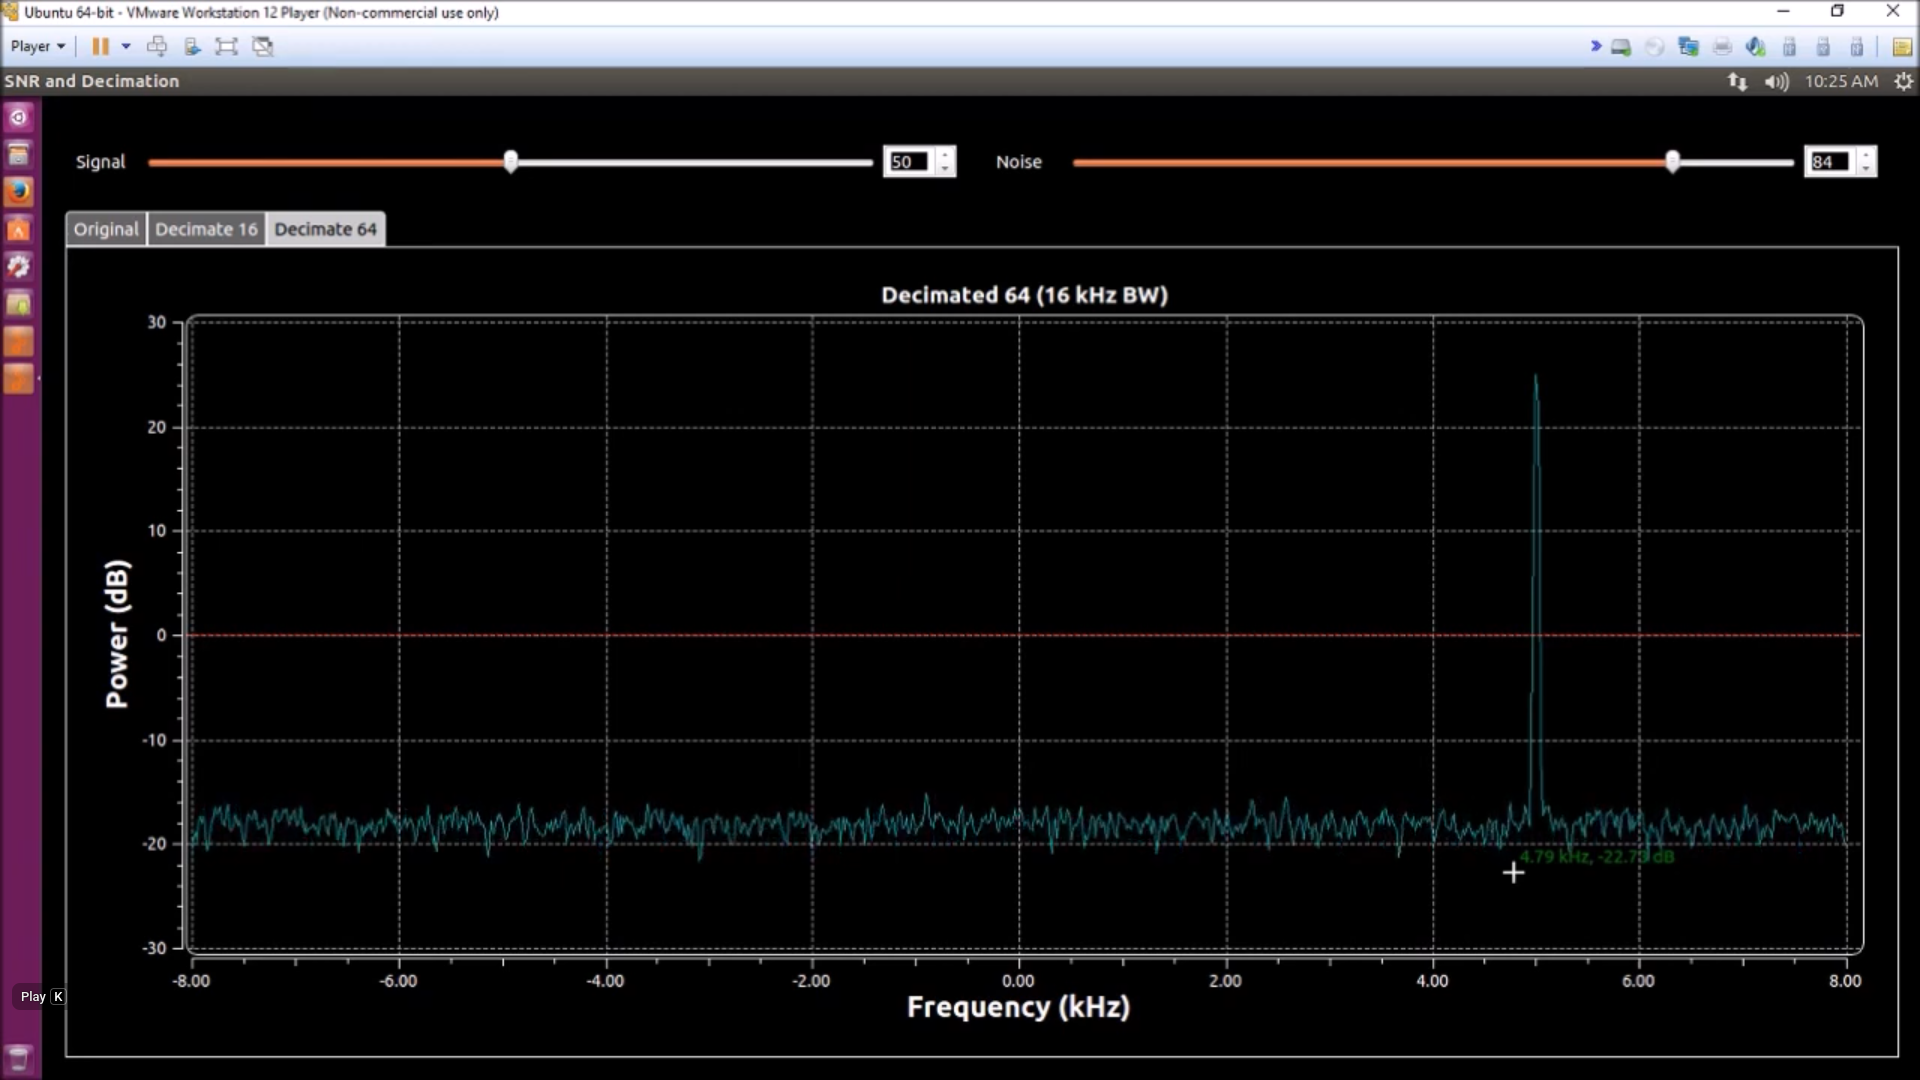
The noise level is now at -18 dB. But the RBW (which is the ENBW) has now been reduced to (16 kHz)(2.0044)/(1024) = 31.3 Hz => 15 dB. Thus, the noise spectral density is now -18 dB - 15 dB = - 33 dB/Hz. This remains the same noise power spectral density as before.
Mistake #6: He Says His SNR Improved by 12 dB Due to His Sample Rate Reduction
At the same time he's pointing out the reduced noise floor, he also says that the SNR has improved by a factor of 16 (12 dB) due to the 16x reduction of sample rate. Wrong. He's actually improved the SNR by a factor of 64 (18 dB) because that is how much noise he filtered out to begin with. His filter is setup to filter out everything above 8 kHz. That leaves a total bandwidth of 16 kHz (+/-8 kHz). His initial bandwidth was 1.024 MHz. This is a reduction of (1.024e6)/(16e3) = 64. That equates to an improvement of 18 dB, not 12 dB as he claims.
Can I demonstrate that it's actually 18 dB vs his claimed 12? Yes, I believe I can. Once again, I'll utilize a time domain display to show the difference.

Mistake #7: The Noise Dropped, but the Signal Didn't
Near the end of this video, he points out that, due to the fact that the signal level didn't drop, but the noise did, and that's proof that the SNR improved. Again, no. The only reason his signal level didn't drop is the fact that he's using an unmodulated tone. Those have a bandwidth of precisely 0 Hz. No bandwidth, in other words. Such a signal will be fully contained within one bin (assuming it's at the center of the bin, as his is) regardless of how low you make the RBW. But if the signal were modulated, meaning it had a bandwidth? Once the RBW is equal to the signal bandwidth, any drop in the RBW will also lower the signal level because now the signal will be spread among multiple bins.
I've already pointed this out (perhaps multiple times), but you have to be extremely careful when measuring power levels in the frequency domain.
What Did He Get Right?
Yes, I get that it seems that I'm dunking on this guy pretty robustly. To try to balance things out, here's what he got right:
You Can Improve the SNR Digitally
This is absolutely, totally true. You can. And using the method he demonstrated, you would see an improvement in SNR. If you filter out the noise by a factor of 64, you'll see an 18 dB improvement in SNR.
Filtering the Noise Helps
Again, near the end of the video, he goes back to his original spectrum and talks about how much of the noise is being "thrown away", and that improves the SNR. Again, absolutely correct. It's the filtering of the noise that improves the SNR.
Wrapping it Up
You might be wondering why I'm presenting this here, and not commenting on either his Youtube channel or blog post. Well, someone already pointed out his major error on his Youtube post. ""brentlocher5049" stated:
John, it is not the decimation that picks up signal to noise ratio....it is the filtering prior to the decimation. The filtering constrains the information into a tighter bandwidth which then allow decimation. IT IS NOT THE DECIMATION. Decimation only picks up calculation efficiency.
To which VE6EY responds with, "Good points. Actually, it's both"
No, no it is not both. It's the filtering. Only the filtering. The decimation doesn't have anything to do with it. Since he didn't seem to get it then, and I've not seen any clarifications since, that says that perhaps he's not going to change his mind. Ergo, this post.